The National Association of Realtors’ Profile of Home Buyers and Sellers is one of the most widely referenced annual reports on U.S. residential real estate behavior. Published each year, the NAR Profile of Home Buyers and Sellers tracks how buyers and sellers navigate the market, covering topics such as demographics, home preferences, financing, search behavior, agent use, and selling experience.
This article brings together findings from the 2020 to 2025 editions to show how buyer and seller behavior changed over time.
Looking across six years makes it easier to spot broader shifts in the market, including changes in first-time buyer participation, financing patterns, search timelines, and reliance on real estate agents.
The table below summarizes several of the clearest trends across those six reports. The sections that follow examine these changes in more detail.
| Category | 2020 | 2021 | 2022 | 2023 | 2024 | 2025 |
|---|---|---|---|---|---|---|
| Median Home Size (sq. ft.) | 1,900 | 1,900 | 1,800 | 1,860 | 1,900 | 1,900 |
| Median Year Home Built | 1993 | 1993 | 1986 | 1985 | 1994 | 1994 |
| Median Duration of the Search (Weeks) | 8 | 8 | 10 | 10 | 10 | 10 |
| Online Search as the First Step (%) | 43 | 41 | 47 | 41 | 43 | 46 |
| Buyers Using Agents (%) | 88 | 87 | 86 | 89 | 88 | 88 |
| Sellers Using Agents (%) | 89 | 90 | 86 | 89 | 90 | 91 |
| Buyers Financing Homes (%) | 88 | 87 | 78 | 80 | 74 | 74 |
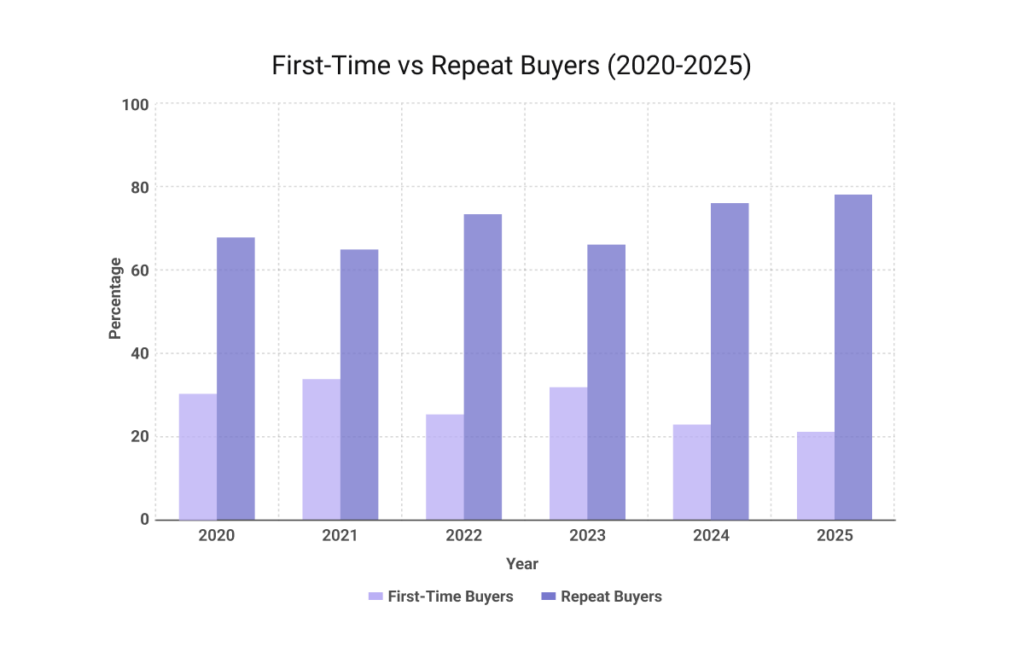
| Proportion of First-Time Buyers (%) | 31 | 34 | 26 | 32 | 24 | 21 |
| Proportion of Repeat Buyers (%) | 69 | 66 | 74 | 68 | 76 | 79 |
Table 1. Key trends from the NAR Profile of Home Buyers and Sellers, 2020–2025.
Characteristics of Home Buyers
Marital Status
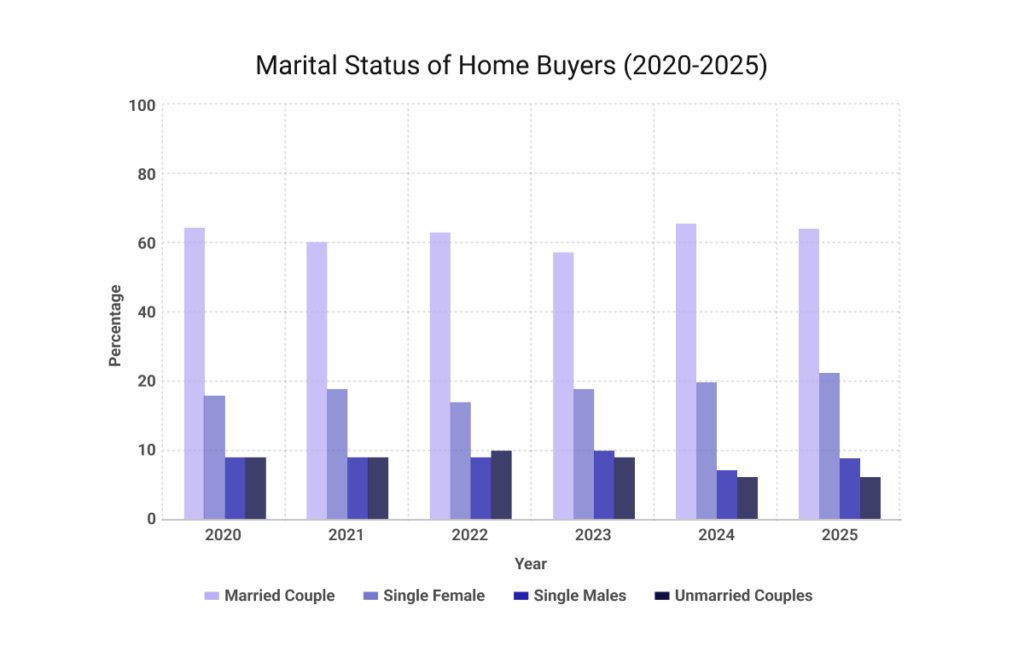
From 2020 to 2025, married couples remained the largest group of home buyers, accounting for 59% to 62% of purchases.
Single women made up the second-largest share at 17% to 21%, consistently outpacing single men, whose share stayed between 8% and 10%.
Unmarried couples accounted for a smaller portion of buyers, ranging from 6% to 10%. The buyer mix changed only slightly across the six-year period, with married couples continuing to dominate the market.
| Household Composition | 2020 | 2021 | 2022 | 2023 | 2024 | 2025 |
|---|---|---|---|---|---|---|
| Married couples (%) | 62 | 60 | 61 | 59 | 62 | 61 |
| Single females (%) | 19 | 19 | 17 | 19 | 20 | 21 |
| Single males (%) | 9 | 9 | 9 | 10 | 8 | 9 |
| Unmarried couples (%) | 9 | 9 | 10 | 9 | 6 | 6 |
Table 2. Household composition of home buyers, 2020–2025.
Racial and Ethnic Composition
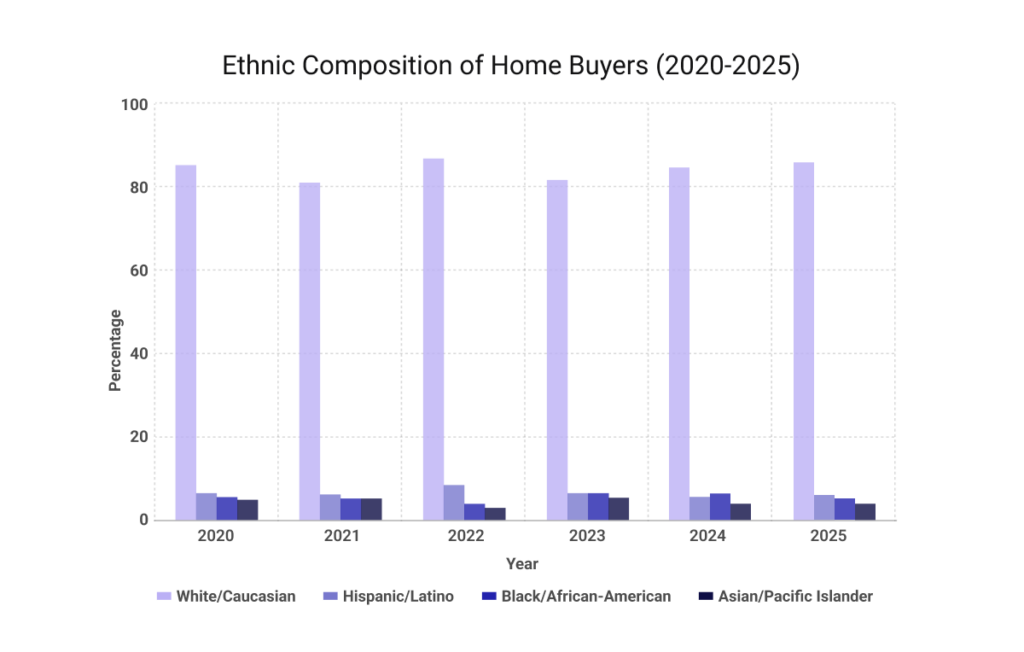
From 2020 to 2025, White buyers accounted for the largest share of home purchases, ranging from 81% to 88%.
Hispanic/Latino buyers made up 6% to 8% of purchasers during this period, while the share of Black buyers ranged from 3% in 2022 to 7% in 2023 and 2024.
Asian/Pacific Islander buyers represented 2% to 6% of buyers. The overall composition changed only modestly across the six-year period.
First-Time vs. Repeat Buyers
The share of first-time buyers changed across the period, rising to 34% in 2021 before falling to a record low of 21% in 2025. The decline reflects the difficulties new buyers face in an increasingly competitive housing market.
Repeat buyers, by contrast, increased their share of the market. They were typically older, had more housing equity, and often had greater purchasing power than first-time buyers.
Their median age rose from 55 in 2020 to 62 in 2025, reinforcing the growing role of more established buyers. In competitive situations, those advantages likely gave repeat buyers a stronger position.
Motivation for Purchasing a Home
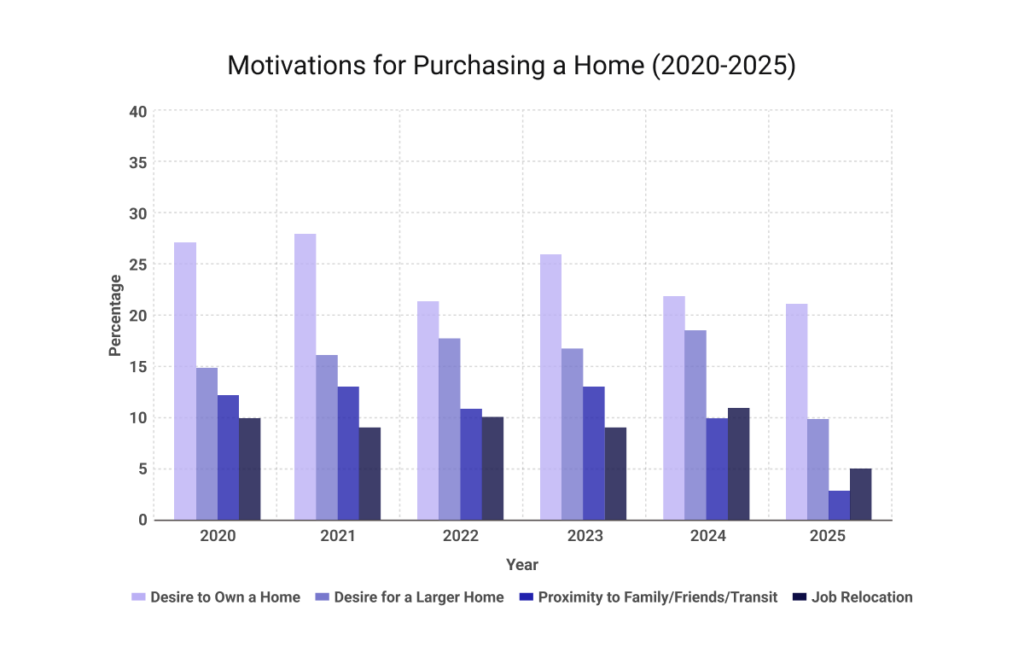
The desire to own a home remained the leading reason buyers purchased homes throughout the period. It peaked at 28% in 2021, then fell to 21% in 2025.
Among first-time buyers, this motivation stayed especially strong, with 64% naming it as their main reason in both 2024 and 2025.
Other common motivations included the desire for a larger home, proximity to family and friends, job relocation, and changes in family situation.
Even when ownership remained the main goal, many purchases were still driven by life-stage changes such as relocation or family needs.
Characteristics of Purchased Homes
The NAR Profile of Home Buyers and Sellers also tracks the homes buyers actually purchased, including home type, size, age, and location.
Types of Homes Purchased
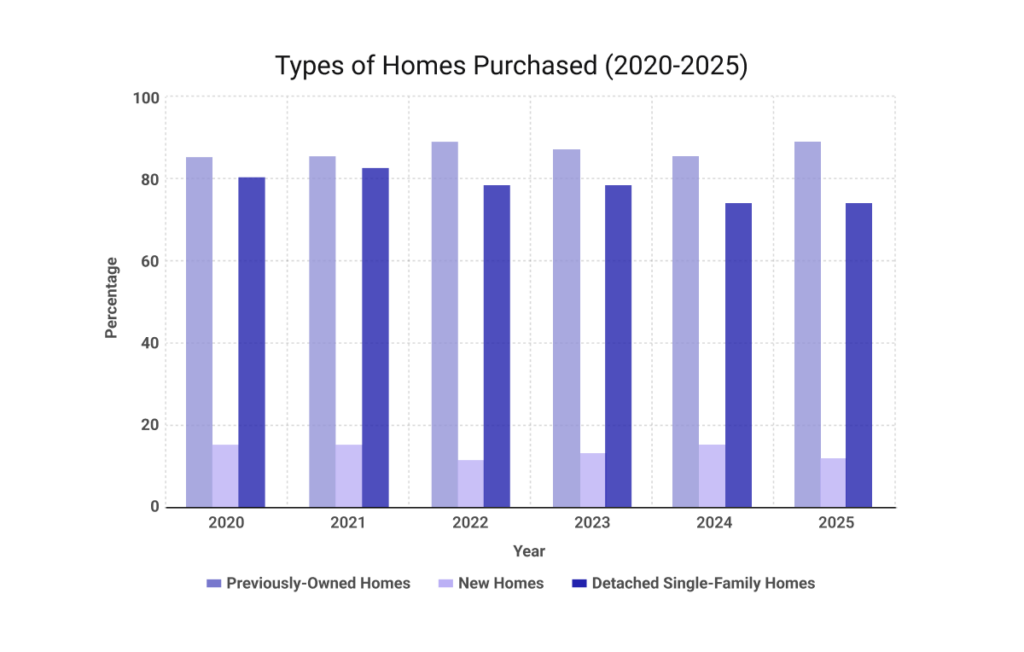
From 2020 to 2025, most buyers purchased previously owned homes, which accounted for 85% to 89% of all home purchases. New homes made up a much smaller share, rising to 15% in 2024 before dropping to 12% in 2025.
Detached single-family homes remained the most common property type, accounting for 75% to 82% of purchases during this period. Their share declined slightly over time, suggesting that some buyers increasingly considered other housing options, including townhouses and condos.
Even with some movement toward townhouses and condos, the market remained centered on previously owned detached homes.
Home Features
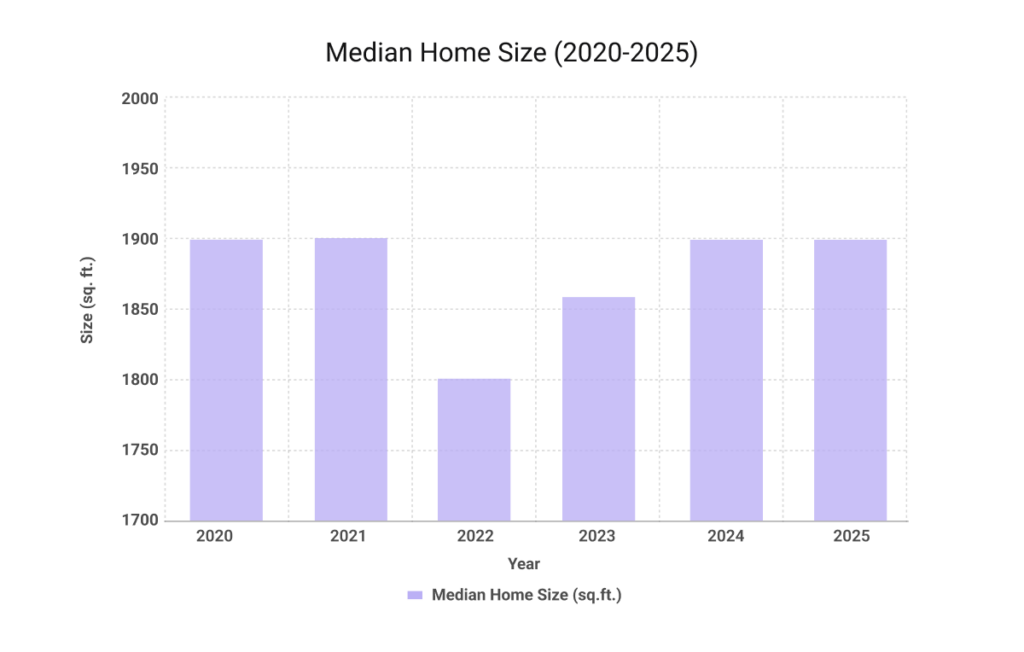
From 2020 to 2025, median home size changed only slightly. It measured 1,900 square feet in 2020, dropped to 1,800 in 2022, and returned to 1,900 square feet in both 2024 and 2025.
The typical layout also remained stable throughout the period, with three bedrooms and two bathrooms as the norm.
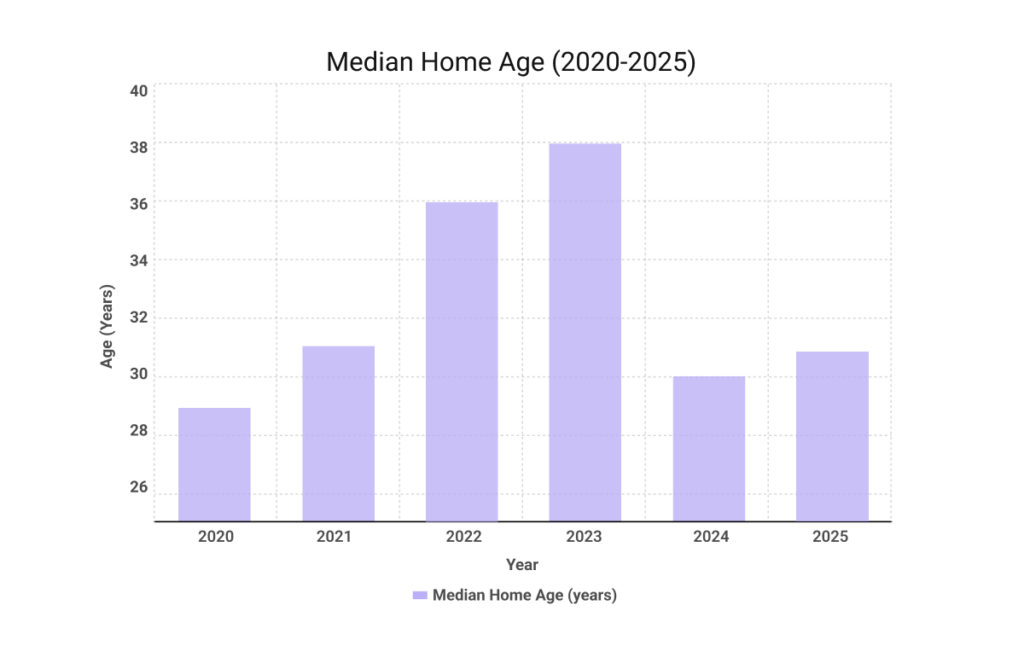
The age of purchased homes shifted more noticeably. In 2022 and 2023, buyers moved toward older homes, with the median year built falling into the mid-1980s.
In 2024 and 2025, that trend reversed, and the median year built returned to 1994. Home size stayed fairly consistent, but buyers adjusted more on home age.
Environmental and Neighborhood Factors
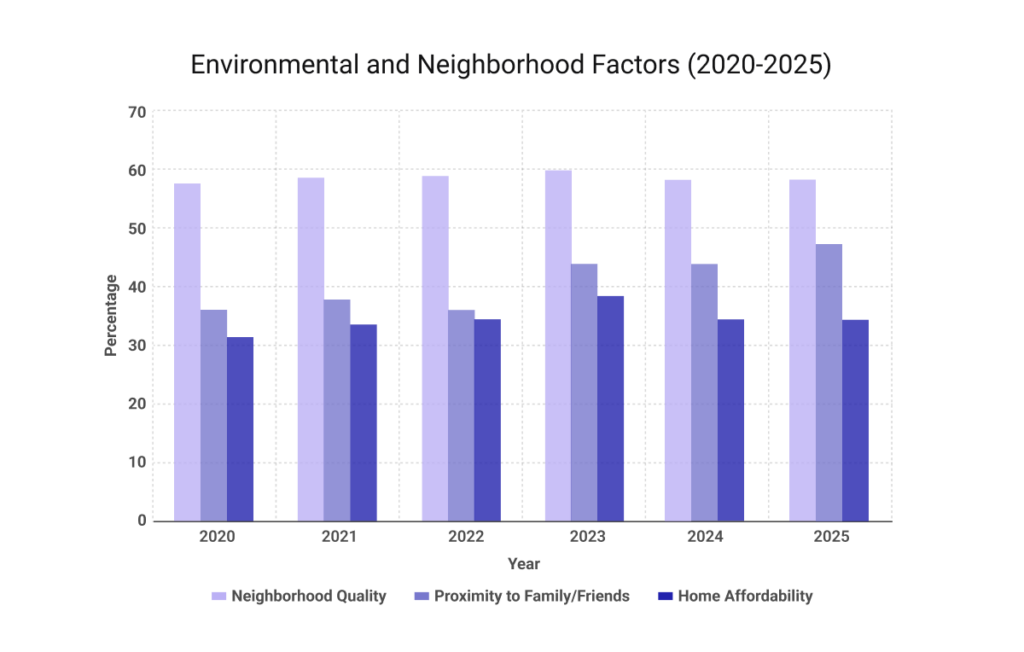
From 2020 to 2025, neighborhood quality remained the most important factor in where buyers chose to live, with 58% to 60% of buyers citing it each year.
Proximity to friends and family became more influential after 2022, reaching 45% in 2023 and 2024 and rising again to 47% in 2025. That shift suggests that personal support networks played a larger role in home location decisions.
Home affordability also became a more prominent factor. The share of buyers who cited it rose from 33% in 2020 to 39% in 2023, then edged down to 36% in 2024 and 35% in 2025.
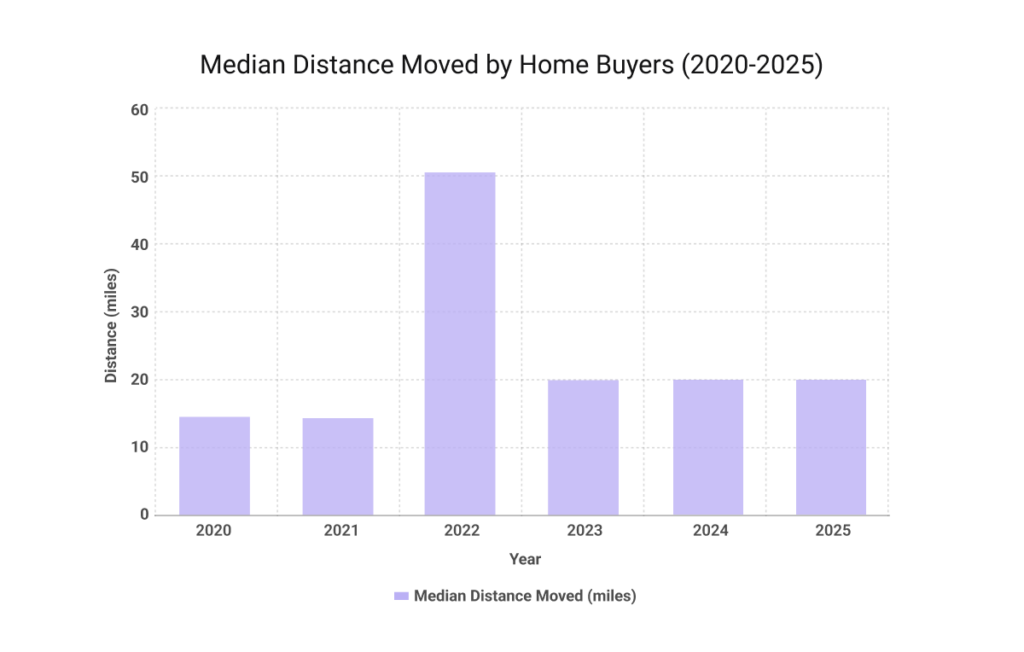
Distance Moved From the Previous Home
From 2020 to 2025, the median distance buyers moved rose sharply and then settled back down. It held at 15 miles in 2020 and 2021, jumped to 50 miles in 2022, and then dropped to 20 miles in 2023, where it remained through 2025.
The spike in 2022 suggests that more buyers expanded their search radius during that period. Remote work and pandemic-era housing shifts likely played a role. By 2023, moving distances had returned to a lower and more stable level.
What the Data Suggests About the Typical Home Buyer
Taken together, the NAR Profile of Home Buyers and Sellers suggests that the typical U.S. home buyer looks for a detached single-family home of about 1,900 square feet, built between the mid-1980s and mid-1990s, located in a desirable neighborhood, and not too far from where they already live.
The Home Search Process
The NAR Profile of Home Buyers and Sellers also shows how buyers begin their search, which tools they use first, and where agents still play a strong role.
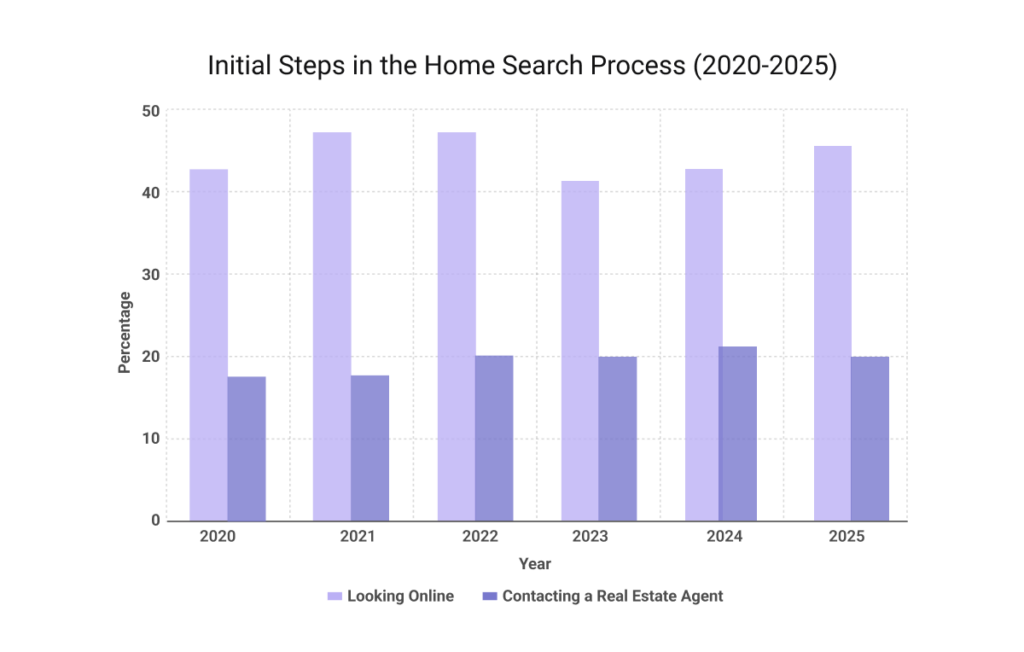
Initial Steps in the Home Search
From 2020 to 2025, searching online remained the most common first step in the home search process, with 41% to 47% of buyers starting there. The share peaked at 47% in 2021 and 2022, dipped to 41% in 2023, and then rose again in the following two years.
Contacting a real estate agent was the second most common starting point, chosen by 18% to 20% of buyers. That pattern suggests that even as online search remains dominant, many buyers still value direct guidance from an agent early in the process.
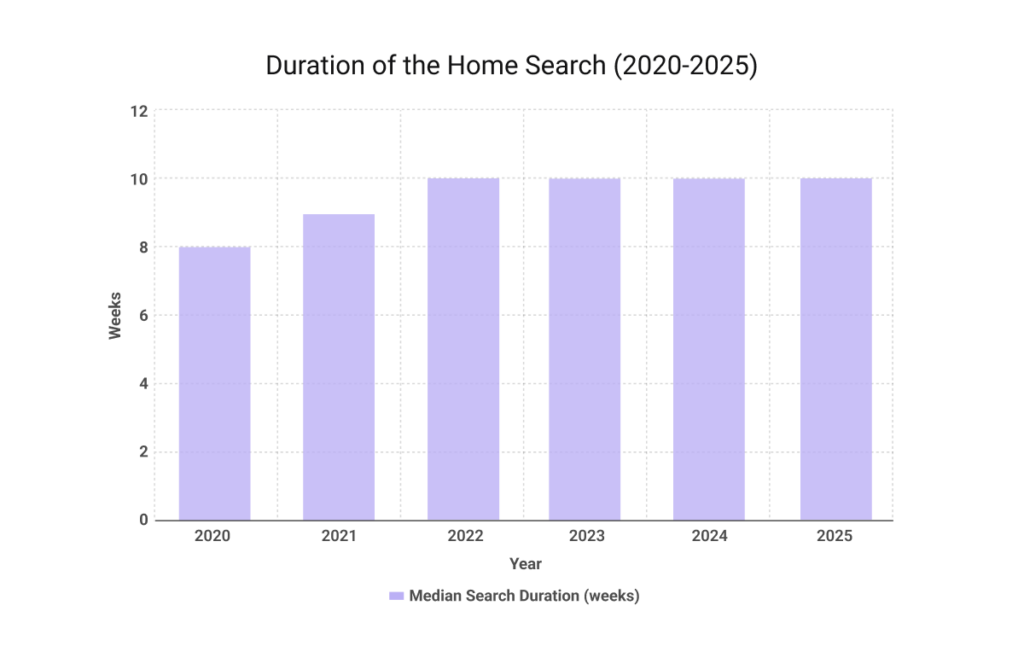
Duration of the Search
The home search took longer over this period. The median search time stayed at 8 weeks in 2020 and 2021, then rose to 10 weeks in 2022 and remained there through 2025.
This pattern suggests that buyers faced a more demanding search process, with tighter inventory and stronger competition giving them less room to move quickly. As a result, many likely needed more time to navigate the competitive housing market and find a suitable home.
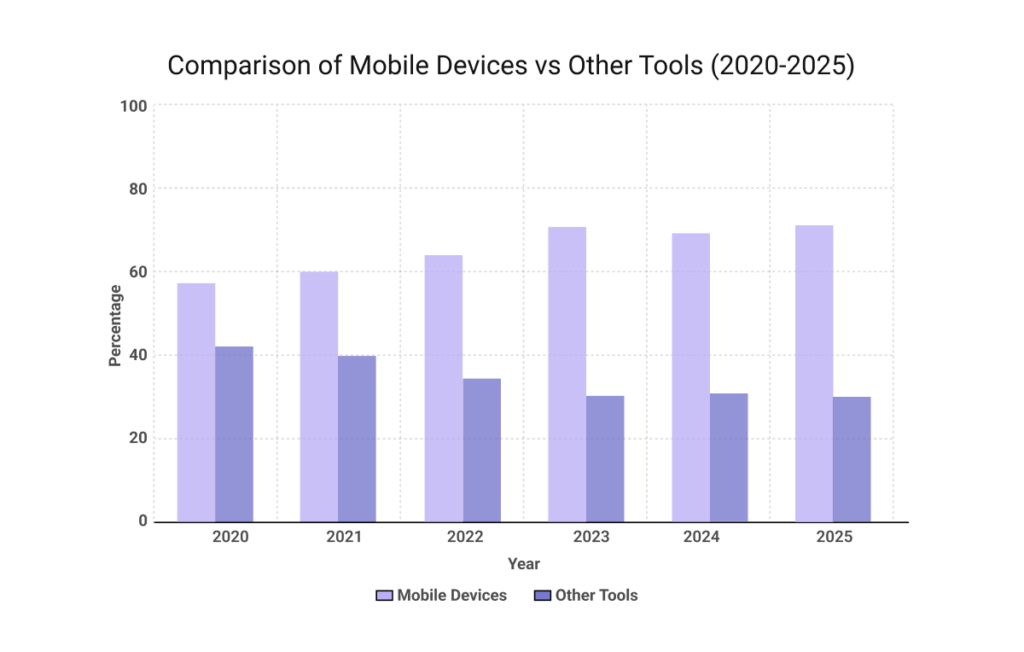
Methods and Tools Used
The tools buyers used during the home search became increasingly digital from 2020 to 2025. By 2022, internet use was nearly universal, with 96% of buyers relying on online resources.
That share remained extremely high through 2024, and the 2025 profile shows that every buyer used the internet during the search process.
Mobile use also increased steadily, rising from 57% in 2020 to 69% in 2023 and 2024, then reaching 70% in 2025. Home search now depends heavily on digital tools.
Recent virtual staging statistics also show how strongly digital presentation influences buyer attention and online engagement.
Challenges During the Search
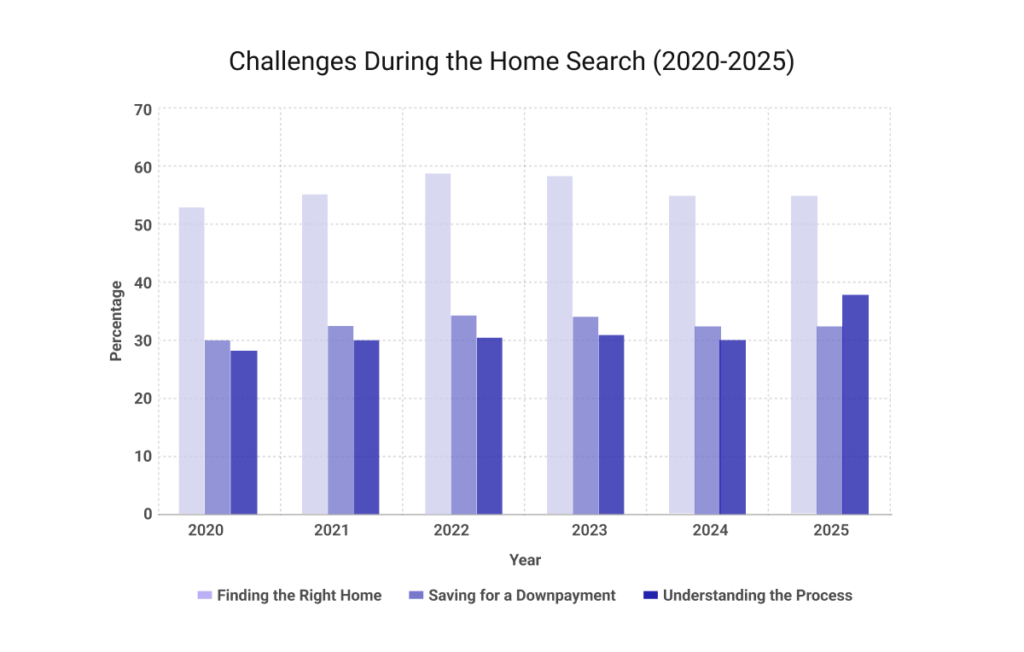
Buyers faced several obstacles during the home search, but finding the right home remained the most common challenge throughout the period.
More than half of buyers cited it each year, and the share reached 56% in 2025. Tight inventory, strong demand, and affordability pressures likely all contributed to that difficulty.
For first-time buyers, saving for a down payment remained one of the biggest barriers. Rising living costs, student loan payments, and credit card debt all made it harder to build enough savings.
Many also struggled with understanding the home-buying process, which 38% identified as a major challenge in 2025. First-time buyers faced both financial and procedural barriers during the search.
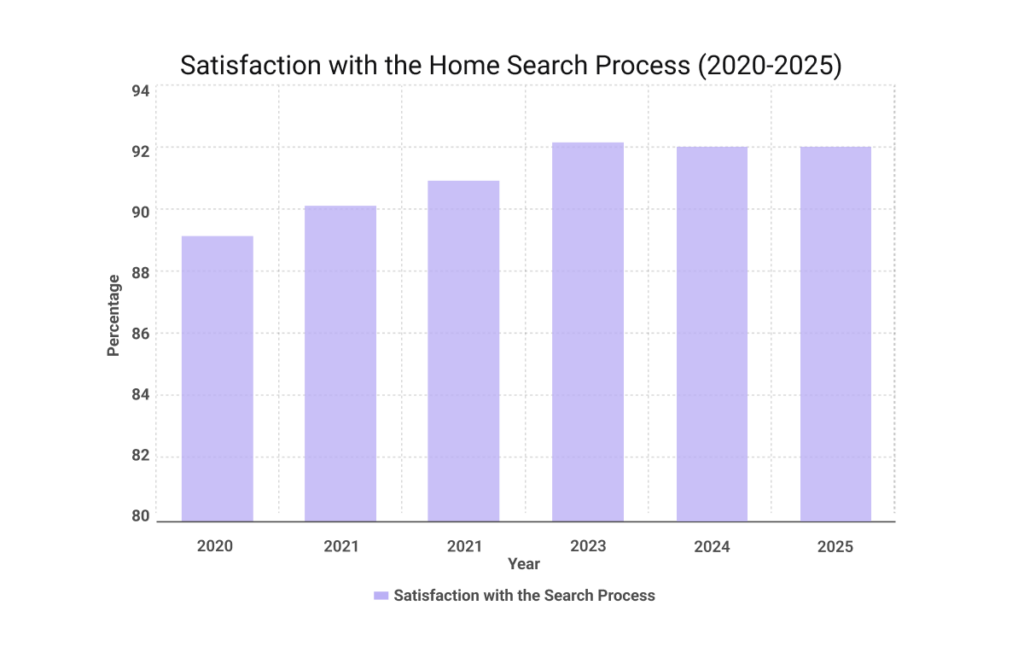
Satisfaction with the Search Process
Satisfaction with the search process increased modestly, rising from 89% in 2020 to 92% by 2023 and remaining there through 2025. Even though buyers often faced a longer and more competitive search, most still reported being satisfied overall.
Home Buying and Real Estate Professionals
NAR’s data also shows how buyers worked with real estate professionals during the purchase process, including how often they used agents and how often they bought directly from sellers or builders.
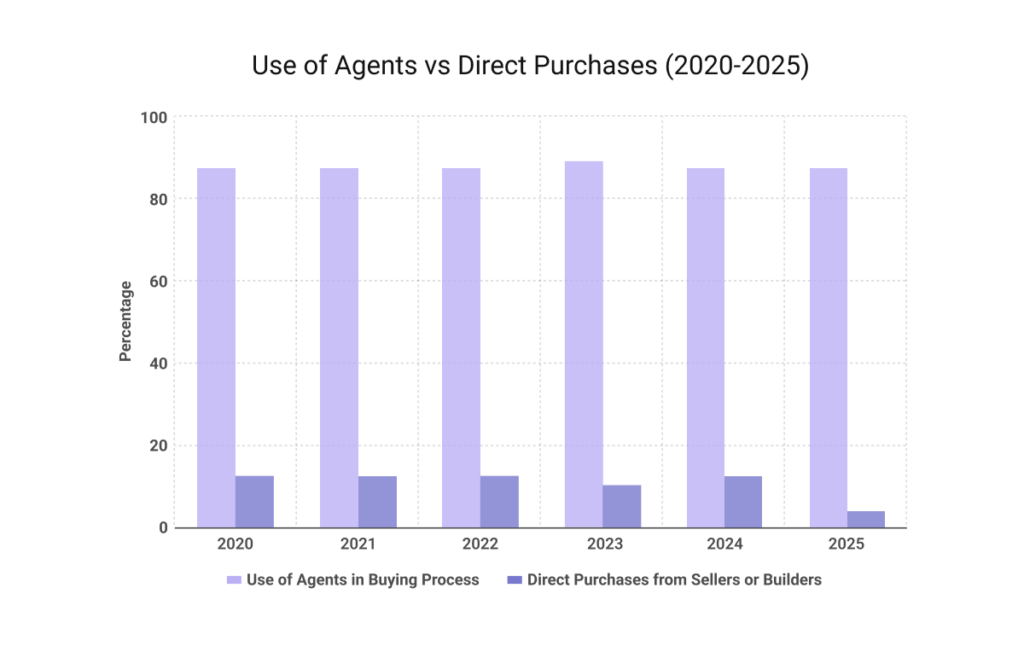
Use of Agents in the Buying Process
Agent use remained high from 2020 to 2025, with nearly 90% of buyers relying on professional guidance throughout the period.
Buyers mainly turned to agents for help finding the right property, negotiating terms, and managing more complex parts of the transaction.
Direct vs. Agent-Assisted Purchases
Direct purchases accounted for a much smaller share of home sales. In 2025, 7% of buyers purchased directly from the previous owner, while 4% bought directly from a builder or a builder’s agent. Most buyers still preferred professional support over handling the purchase directly.
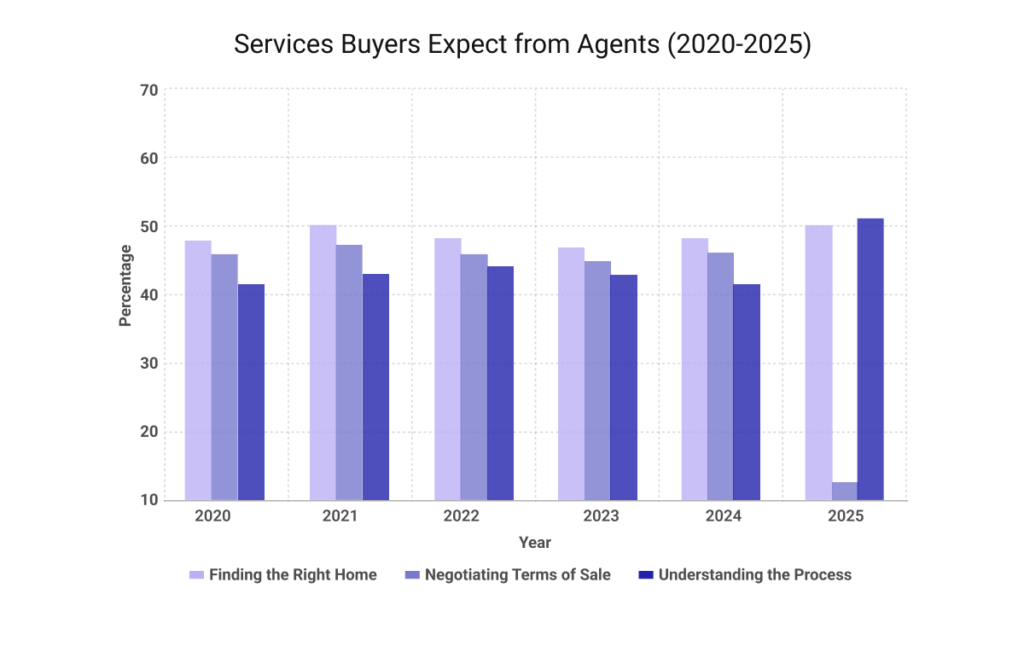
Services Buyers Expect From Agents
Buyers continued to rely on agents for several core services during the home-buying process. The most common expectation was help finding the right home, which 50% of buyers identified as the service they valued most in 2025.
Buyers also looked to agents for help negotiating terms, understanding the home-buying process, and managing pricing discussions and paperwork.
For first-time buyers, support with the buying process remained especially important. Although the share fell from 80% in 2024 to 76% in 2025, many still relied on agents to understand the process, arrange financing, and handle paperwork.
That pattern suggests that buying a home still feels especially complex for less experienced buyers.
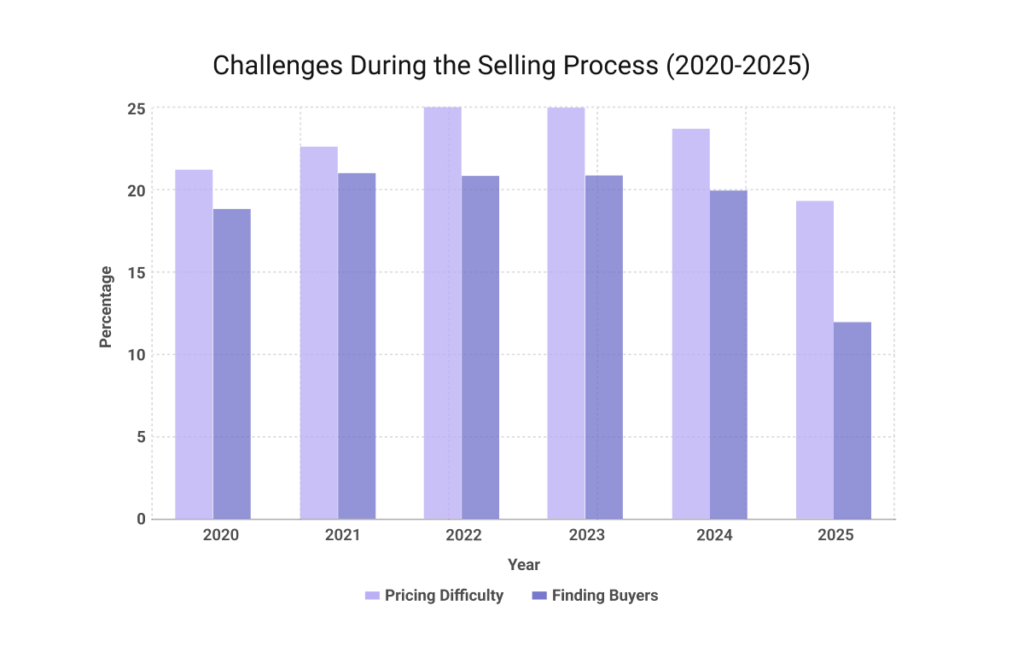
Challenges During the Selling Process
Pricing remained the more common challenge for sellers. The share who cited it rose from 22% in 2020 to 25% in 2022 and 2023, then slipped to 24% in 2024 and dropped to 19% in 2025.
Finding the right buyer followed a similar pattern at a lower level. It affected 19% of sellers in 2020, rose to 21% from 2021 through 2023, eased to 20% in 2024, and then fell more sharply to 12% in 2025.
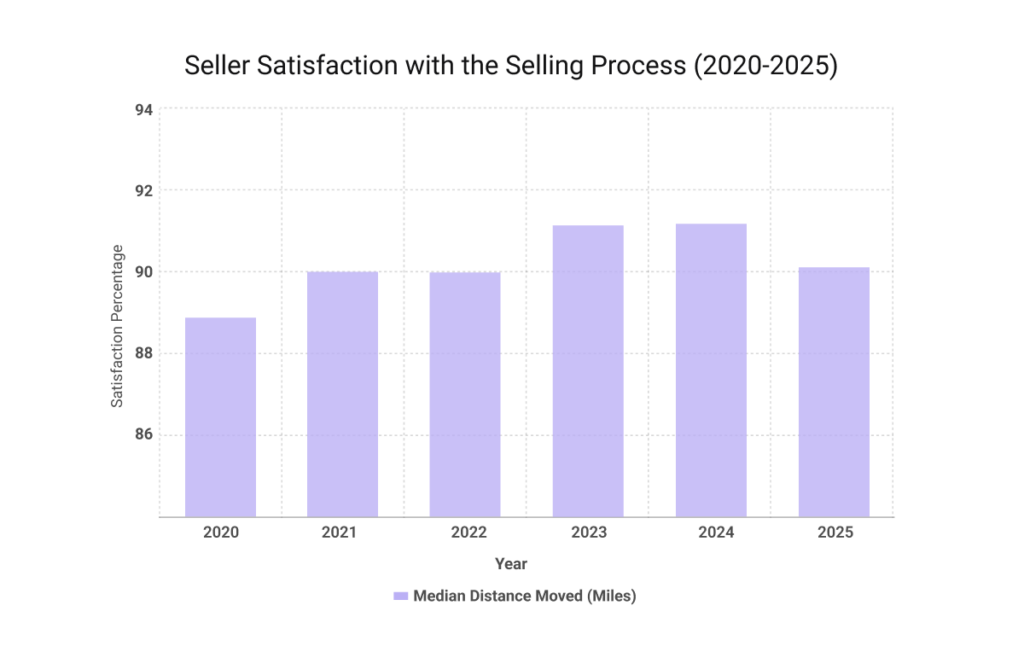
Seller Satisfaction
Seller satisfaction remained high throughout the period. It increased from 89% in 2020 to 91% in 2023 and 2024 before easing slightly to 90% in 2025.
Pricing and Timing of Home Sales
Pricing and timing trends in the NAR Profile of Home Buyers and Sellers show that sellers generally priced homes competitively and often sold close to the asking price.
In 2025, homes typically sold for 99% of asking price, and 17% sold for more than asking. Homes also continued to sell relatively quickly, although the pace slowed somewhat in 2025, when the typical sale took four weeks instead of two to three.
Home Selling and Real Estate Professionals
Around 90% of sellers relied on real estate agents to price homes competitively, negotiate terms, and attract buyers through tools such as online listing exposure and photography.
Sellers also tended to choose agents through referrals, while many repeat sellers returned to agents they had worked with before. Most interviewed only one agent, and nearly 90% reported overall satisfaction with their agent.
Reasons for Selling
Across the period, sellers most often said they wanted to move closer to family and friends. They also sold because they needed a larger or smaller home or because their personal circumstances changed.
Common challenges included preparing the home for sale, marketing it effectively, and choosing the right time to sell.
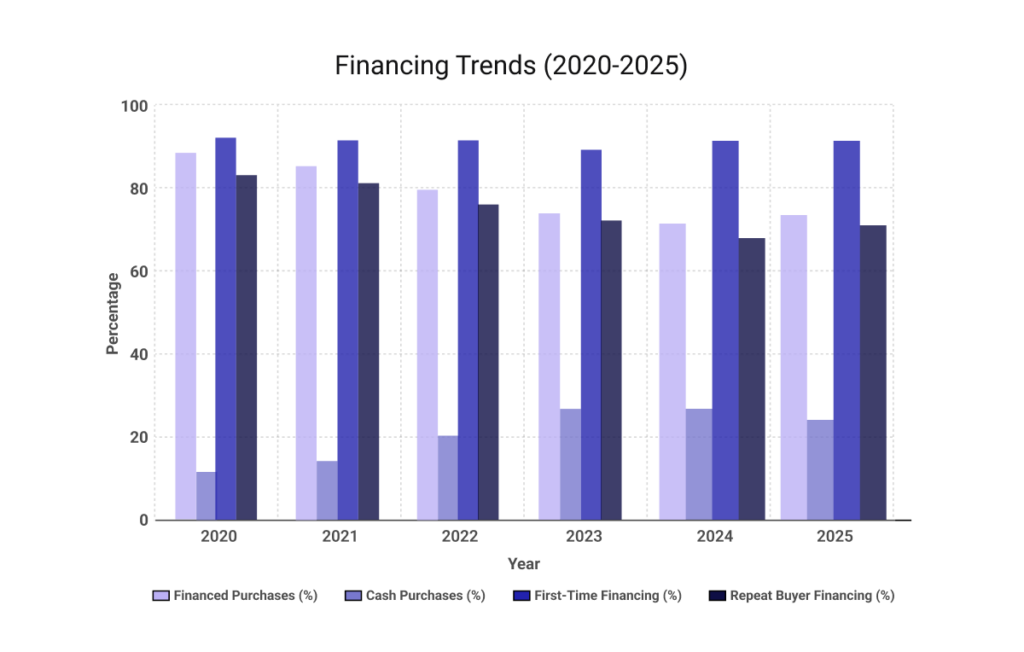
Financing the Home Purchase
From 2020 to 2025, fewer buyers financed their home purchases, while cash purchases became more common. The share of buyers using financing fell from 88% in 2020 to 74% in 2024 and remained there in 2025.
First-time buyers still relied heavily on financing, with more than 90% using loans each year. Repeat buyers relied less on financing, dropping from 83% in 2020 to 69% in 2024 before edging up to 70% in 2025.
Down payments also increased over time. For first-time buyers, the typical down payment rose from 6% in 2020 to 9% in 2024 and 10% in 2025, matching the highest level recorded since 1989. For repeat buyers, the typical down payment climbed from 16% in 2020 to 23% in 2024 and remained at 23% in 2025.
Repeat buyers were generally in a stronger financial position, while first-time buyers faced tighter limits.
Final Thought
The NAR Profile of Home Buyers and Sellers reveals several clear patterns across the past six years. Three trends stand out most clearly.
First, the share of first-time buyers declined, largely because rising home prices and higher down payment requirements made it harder to enter the market.
Second, both buyers and sellers continued to report high satisfaction with real estate agents, reinforcing the value of professional guidance in a demanding market.
Third, the longer home search period points to a more competitive environment, with tighter inventory and more pressure on buyers to act strategically.
Taken together, these six years of data offer a broader view of how the U.S. housing market changed over time.
As NAR continues to publish the NAR Profile of Home Buyers and Sellers, the reports will remain a useful source for understanding how buyers and sellers respond to shifting market conditions.
They also help real estate professionals track changing expectations, adjust their strategies, and respond more effectively to the needs of both buyers and sellers.
FAQs
What are the main trends in the NAR Profile of Home Buyers and Sellers from 2020 to 2025?
Some of the clearest trends include a shrinking share of first-time buyers, strong reliance on agents, longer home search periods, high seller satisfaction, and a lower share of financed purchases.
What type of home do most buyers prefer?
Most buyers purchased previously owned detached single-family homes. The data also shows that the typical home purchased had about 1,900 square feet, three bedrooms, and two bathrooms.
What factors matter most to buyers when looking for a home?
Neighborhood quality ranked first. Buyers also placed strong weight on proximity to family and friends, along with home affordability.
What is the median age of a first-time home buyer in the U.S.?
According to the NAR Profile of Home Buyers and Sellers, the median age of a first-time home buyer reached 40 in 2025, up from 38 in 2024. That increase reflects how difficult it has become for many younger buyers to enter the market.
How does technology shape the home search process in the U.S.?
Online search remained the main starting point for buyers, and internet use became nearly universal. Mobile devices also played a growing role, reinforcing how central digital tools have become to the home search process.
References
National Association of Realtors. (2020) 2020 NAR Profile of Home Buyers and Sellers. National Association of Realtors. Retrieved from: https://www.nar.realtor/sites/default/files/documents/2020-profile-of-home-buyers-and-sellers-11-11-2020.pdf
National Association of Realtors. (2021) 2021 NAR Profile of Home Buyers and Sellers. National Association of Realtors. Retrieved from: https://www.nar.realtor/sites/default/files/documents/2021-highlights-from-the-profile-of-home-buyers-and-sellers-11-11-2021.pdf
National Association of Realtors. (2022) 2022 NAR Profile of Home Buyers and Sellers. National Association of Realtors. Retrieved from: https://www.nar.realtor/sites/default/files/documents/2022-highlights-from-the-profile-of-home-buyers-and-sellers-report-11-03-2022_0.pdf
National Association of Realtors. (2023) 2023 NAR Profile of Home Buyers and Sellers. National Association of Realtors. Retrieved from: https://www.nar.realtor/sites/default/files/documents/2023-profile-of-home-buyers-and-sellers-highlights-11-13-2023.pdf
National Association of Realtors. (2024) 2024 NAR Profile of Home Buyers and Sellers. National Association of Realtors. Retrieved from: https://www.nar.realtor/sites/default/files/2024-11/2024-profile-of-home-buyers-and-sellers-highlights-11-04-2024_2.pdf
National Association of Realtors. (2025) 2025 NAR Profile of Home Buyers and Sellers. National Association of Realtors. Retrieved from: https://www.nar.realtor/sites/default/files/2025-11/2025-profile-of-home-buyers-and-sellers-highlights-11-04-2025.pdf