Two agents can cite the same stats and still get two different reactions. The difference often comes down to absorption rate real estate, and how clearly the number gets translated into a decision. Sellers and buyers rarely care about formulas. Clients care about timing, pricing power, and risk.
Absorption rate turns raw MLS activity into a simple story about speed. It also becomes a trust signal when agents explain it in plain language, and tie it to a specific neighborhood and price band. That communication skill supports stronger pricing talks and smarter offer strategy.
Absorption rate also fits naturally into broader real estate marketing strategies because market clarity makes every listing message sharper. For bigger context, market narratives land best when they align with 2026 real estate market trends instead of fighting the headlines.
Absorption Rate Real Estate Explained for Client Conversations

Clients rarely argue with math. Clients argue with what the math seems to imply about their goals. Absorption rate helps because it answers one practical question: how quickly the current inventory gets “consumed” by buyers in a specific segment.
A clean definition sounds like this: real estate absorption rate measures the pace of sales compared to the number of active listings in the same market slice and time window. A higher rate signals faster demand relative to supply. A lower rate signals more supply relative to demand.
The best explanation uses a familiar analogy. Think of a grocery store tracking sell-through. When a product sells through quickly, the store restocks and keeps pricing firm. When it sits, the store runs discounts. Housing works the same way. Absorption rate is the sell-through rate for listings.
Two backup analogies help when the grocery comparison feels off. A restaurant tracks how fast tables get booked for prime time. A theater tracks how quickly seats get claimed for a new release. Both examples link speed to pricing power.
Absorption rate does not answer everything. It does not grade condition, layout, or location within a neighborhood. It also does not explain why a specific listing stalled. That is where days on market, list-to-sale ratio, and listing presentation choices matter.
How to Calculate Absorption Rate Real Estate From MLS Data

A strong calculation starts with consistency, not complexity. Agents need one repeatable window, one repeatable segment definition, and one place to record results. The goal is a number that can be tracked over time, not a one-off stat pulled for a single conversation.
Time window choices usually come down to a shorter view that reacts faster and a longer view that smooths noise. The same market can look different across windows, so agents should choose one default and then add a second window only when a client needs trend context.
Segment definition matters more than most agents expect. A city-wide absorption rate can hide a fast entry-level segment and a slow luxury segment. The calculation should match the client’s likely buyer pool, not a broad county report.
Step one: Pick the segment and time window
Agents start by locking the segment, such as a neighborhood plus a property type, then picking a consistent time window. A narrow segment keeps the story relevant. A consistent window keeps month-to-month comparisons honest. The expected result is a clear scope statement that can be repeated in every client update.
Step two: Pull closed sales for the chosen window
Agents pull the number of closed sales that match the segment and time window. Closed sales provide the cleanest signal because they reflect completed demand. Pending sales can support a trend note, but closed sales should anchor the math. The expected result is a single sold count that matches the segment definition.
Step three: Pull active listings in the same segment
Agents pull the number of active listings that match the same filters used for the sold count. Mixed filters create misleading outcomes and spark client distrust. A quick scan for duplicates and off-market statuses prevents obvious errors. The expected result is a single active count that reflects real available choice.
Step four: Run the formula and label it clearly
Agents divide sold by active, then multiply by one hundred. Clear labels matter because clients confuse absorption rate with price change and interest rates. A short note should state the window and segment right next to the result. The expected result is one labeled figure that can sit on a one-page snapshot.
Step five: Sanity-check the sample size
Agents check for tiny segments that swing wildly, like a micro-neighborhood with only a few sales. Small numbers can still inform a conversation, but they need framing. A simple fix involves widening the window, widening geography slightly, or adding a comparable segment. The expected result is a number that feels stable enough to discuss with confidence.
Step six: Record a trend line, not a single point
Agents log the result monthly in the same sheet or slide template. Trend direction often matters more than the current value. A rising trend supports urgency stories, while a falling trend supports patience and pricing discipline. The expected result is a simple track record that improves every future consultation.
Agents should keep the deliverable simple. A client handout should show the segment, the time window, and a short plain-language meaning. The deeper “why” belongs in the live conversation.
Buyer’s Market vs Seller’s Market Absorption Rate and Local Benchmarks
National thresholds help clients orient quickly, but local context keeps the metric honest. Many agents use a buyer-leaning benchmark around 15% and a seller-leaning benchmark around 20% as quick reference points. Local MLS behavior can shift those lines, especially in small towns, resort markets, and luxury segments.
Calibration can stay simple. Agents can pull a year of monthly absorption rate results for the same segment, then mark what “normal” looked like before a major rate shock or inventory shift. That historical band becomes the local benchmark for that neighborhood and property type.
| Market signal | What clients often feel | Best message focus |
|---|---|---|
| Below the buyer-leaning benchmark | “Listings sit unless priced low.” | Price discipline, stronger presentation, longer timeline |
| Near the local middle band | “Some homes move, some stall.” | Clear positioning, accurate comps, clean negotiation plan |
| Above the seller-leaning benchmark | “Homes disappear fast.” | Speed, offer strength, clean terms, fast decision-making |
Segmenting prevents bad advice. A condo segment can slow while nearby single-family homes stay tight. A school zone boundary can change the story from one street to the next. Investors also distort segments, especially in starter-home ranges.
Absorption rate also pairs naturally with monthly communication. A short market note that tracks the same segment each month fits a real estate newsletter because the story stays consistent and repeatable.
Explaining Absorption Rate to Sellers Without Triggering Price Fights
Most pricing fights start with mismatched mental models. Sellers picture last year’s headlines. Buyers respond to today’s competition. Absorption rate gives sellers a neutral way to see which side currently has leverage, without turning the meeting into an argument about opinions.
Seller explanations work best when they connect the rate to two things: the size of the buyer pool and the cost of being wrong. In a faster segment, an ambitious price can still work if presentation and condition support it. In a slower segment, the same ambition often leads to a longer market time and larger reductions.
Seller script for a fast segment: Agent: “The neighborhood is selling through inventory quickly. That pace gives sellers pricing power, but buyers still compare options. The strongest plan prices within the core buyer search band and pushes attention early.”
Seller script for a slow segment: Agent: “Inventory is taking longer to get absorbed. Buyers have more choices and more time. The best strategy creates urgency with price discipline, clean visuals, and a clear value story from day one.”
Absorption rate becomes more persuasive when it shows up in the listing plan, not just a chart. Data should shape how the listing gets positioned, photographed, and described. Many agents pair the metric with concrete actions that enhance your real estate listings and tighten the copy in listing descriptions.
Pre-meeting delivery timing also matters. Agents should send a one-page market snapshot two days before the appointment. That window gives enough time for review, without inviting a week of outside opinions. The deliverable should include the absorption rate trend, a simple segment definition, and a short meaning statement. The in-person conversation should hold back the detailed pricing recommendation, negotiation posture, and concession plan so the agent can read reactions and adjust.
Commission or fee figures should not appear in the pre-sent package. Clients often anchor on the number before they understand the plan. The meeting should cover the marketing and pricing logic first, then handle fees after value gets established.
Any AI-edited or virtually staged images also require clear labeling. Disclosure: “Some images have been virtually staged and/or digitally enhanced. These images are for illustration only and may not represent actual property conditions.” Agents should apply a Virtually Staged Watermark where required and follow MLS Rules for photo labeling.
Explaining Absorption Rate to Buyers and Investors With Segmented Data
Buyers and investors both ask the same question in different language: how hard will it be to get the deal done. Absorption rate answers that, but only when the segment matches the client’s target. A city-wide number can mislead a first-time buyer shopping one school zone, and it can mislead an investor targeting a specific rental corridor.
A client-ready explanation avoids jargon. Absorption rate can be framed as “competition speed.” Faster speed means buyers need stronger terms and faster decisions. Slower speed means buyers can negotiate, but they still need to avoid stale listings with hidden problems.
Segmentation also keeps investor conversations grounded. Investors care less about the average home and more about the exact band where capital will land. A segment should match rentability, HOA constraints, and likely exit buyers.
Buyers: turning absorption into an offer plan
A buyer consultation should translate absorption rate into actions, not anxiety. Agent: “The segment is moving quickly, so the offer needs clean terms and a tight timeline. The plan targets homes that match the budget band and checks each listing’s days on market to spot outliers.” That approach pushes urgency without sounding like pressure.
Low absorption rate supports a different script. Agent: “The segment is moving slowly, so negotiation room exists. The plan focuses on listings that have sat, then builds offers around inspection clarity and realistic pricing. A slow segment still rewards strong due diligence and clean financing.”
The “market crash” objection also needs a calm data frame. Agent: “Headlines cover the whole country. This segment shows how buyers are acting locally right now. A decision can be built around local absorption, price reductions, and days on market, not national fear.”
Investors: segmenting by price band, property type, and micro-market
An investor update should never rely on a single city-wide metric. Absorption rate should be segmented by property type, such as single-family, condo, or small multi-family, because each behaves like a different market. The same logic applies to price band, since entry-level demand often stays stronger than luxury demand.
A clean investor summary can follow a fixed template: segment definition, absorption trend direction, months of inventory real estate in plain language, and a short buy-hold-sell implication. Agents can also map segmented absorption rate to farm areas, because farm performance depends on micro-market velocity. That approach aligns with a real estate farming strategy.
Edge cases deserve direct mention in investor talks. New construction releases can flood inventory in bursts. Rural and agricultural areas often show thin volume that distorts the rate. Distressed sales can skew the “sold” count with price points that do not match retail listings. Condo segments can swing with HOA rule changes. Luxury segments can stall from one withdrawn listing.
Presenting Absorption Rate as a Market Story in Materials and Marketing
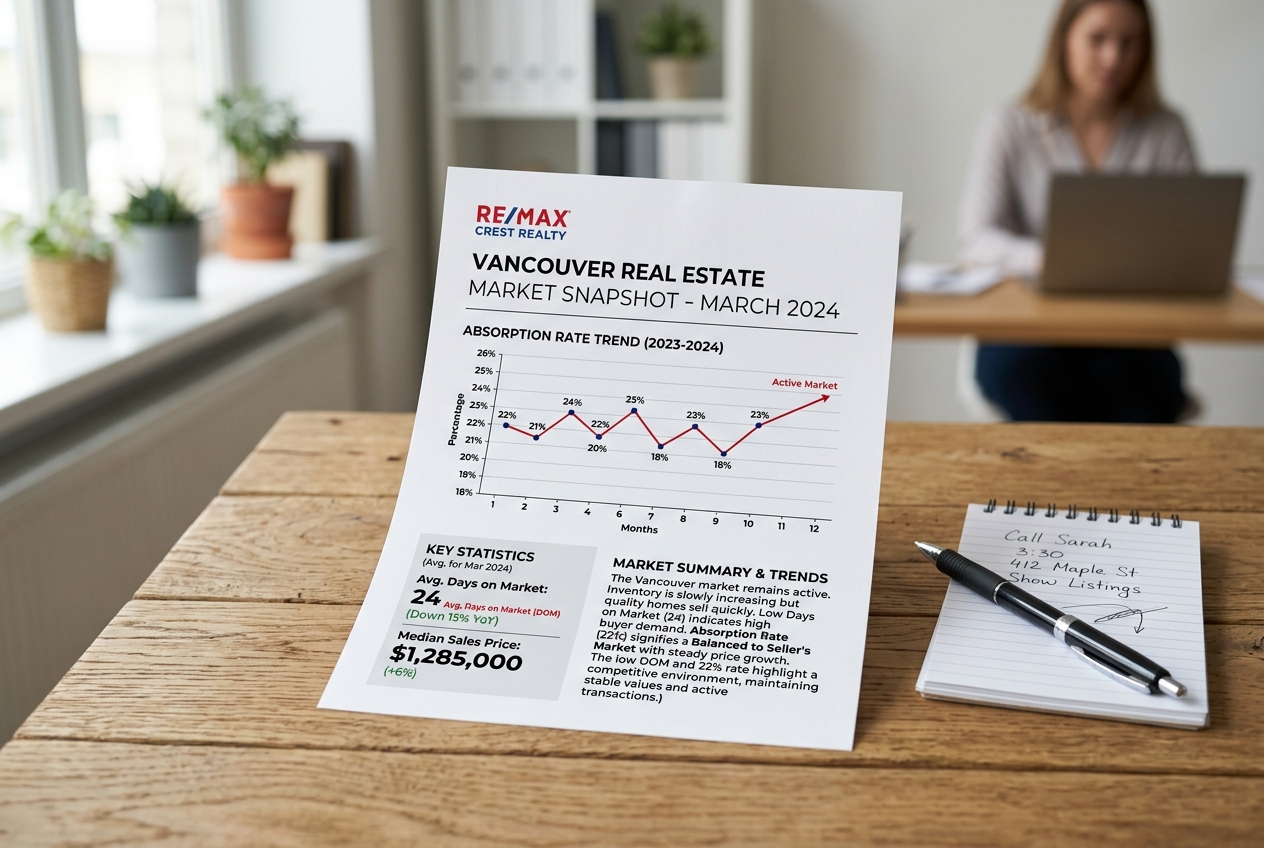
Most clients understand a market faster through one page than through ten charts. A simple snapshot can include a short absorption rate trend, days on market context, and a plain-language interpretation line. The visual should stay clean and repeat the same format each month so clients learn how to read it.
A practical design rule helps: one chart per idea. A line chart can show the trend. A small bar can compare the client’s segment to the broader area. Too many segments on one slide creates noise, and noise drives objections.
Absorption rate also gains power when it sits inside a four-metric story. Absorption rate signals market velocity. Days on market shows how quickly the typical listing gets accepted. Months of supply signals inventory depth. List-to-sale ratio signals pricing pressure and concession risk. Together, those four metrics explain why “the market feels slow” can be true for one listing and false for the segment.
Objection handling gets easier with a fixed response pattern. First, name the feeling without arguing. Second, show the segment definition so the client trusts the comparison set. Third, connect the metric to a decision, such as pricing within the buyer pool or adjusting offer terms. That pattern keeps the conversation about actions instead of debates.
AI can support this workflow when it reduces production time. AI in real estate marketing increasingly supports templated reporting, consistent visuals, and repeatable client updates. AI HomeDesign also supports listing presentation choices through AI Virtual Staging, AI Item Removal, AI Day to Dusk, and Image Enhancement, with clear disclosure and watermark practices.
For agents building a full market-content engine, absorption rate fits into the larger Ultimate Real Estate Marketing Guide. The strongest results come from repeating the same market story across consults, emails, and listing presentations, then adjusting only the segment and the script.
Frequently Asked Questions
What is absorption rate in real estate in simple terms?
Absorption rate is a speed measure. It shows how quickly buyers are purchasing the homes that are currently for sale in a specific market segment. A higher absorption rate means inventory gets “used up” faster, which often supports firmer pricing. A lower rate means inventory moves slower, which often supports negotiation and longer timelines.
What time window works best for absorption rate calculations?
A shorter window reacts faster to new demand, while a longer window smooths out weekly noise. Many agents choose one default window for monthly tracking, then add a second window only when clients need trend context. The best choice stays consistent across reports so the change over time remains meaningful.
Is absorption rate the same as months of supply or months of inventory?
They describe the same supply-and-demand balance from different angles. Absorption rate describes how much inventory sells within a set time window, which reads like a market “sell-through” speed. Months of supply or months of inventory describes how long current inventory would last at the current sales pace, which reads like market “depth.”
How can an agent explain absorption rate without using jargon?
A simple framing is “competition speed.” If homes get absorbed quickly in the segment, buyers compete harder and sellers hold more pricing power. If homes absorb slowly, buyers gain more choice and more negotiating room. Agents can then connect that speed to one next step, such as pricing discipline or stronger offer terms.
Can absorption rate be misleading in small or unusual markets?
Yes. Thin-volume segments can swing sharply from a few closings, which can overstate changes in demand. New construction releases can also distort inventory counts, and luxury segments can look slow simply because buyer pools stay small. In those cases, agents can widen the time window, expand the segment, and add days on market context.